Data is the lifeblood of modern business and now we’re generating more than ever. But the collection of piles of digital information isn’t of much use unless the organization is able to process it in a sensible way. And, that’s where a business intelligence software comes to the rescue. Power BI pulls the data together and processes it to intelligent insights using visually compelling and easy-to-process graphs, charts, and documents. This allows users to generate and share clear and useful insights into what’s happening in the business. Just think about how implementing a platform can help you such useful information to help you make actionable decisions? In this post, we’re going to discuss how integrating PowerApps, Power BI and Flow will help you to create real-time streaming applications. So, let’s get started.
Here, we will demonstrate how integrating PowerApps, Power BI and flow will help you to create a streamline application by creating a scoreboard application.
Step 1: Let’s create an app workspace to host the application
Log in to PowerBI.com and then move towards Workspaces -> New Workspace.
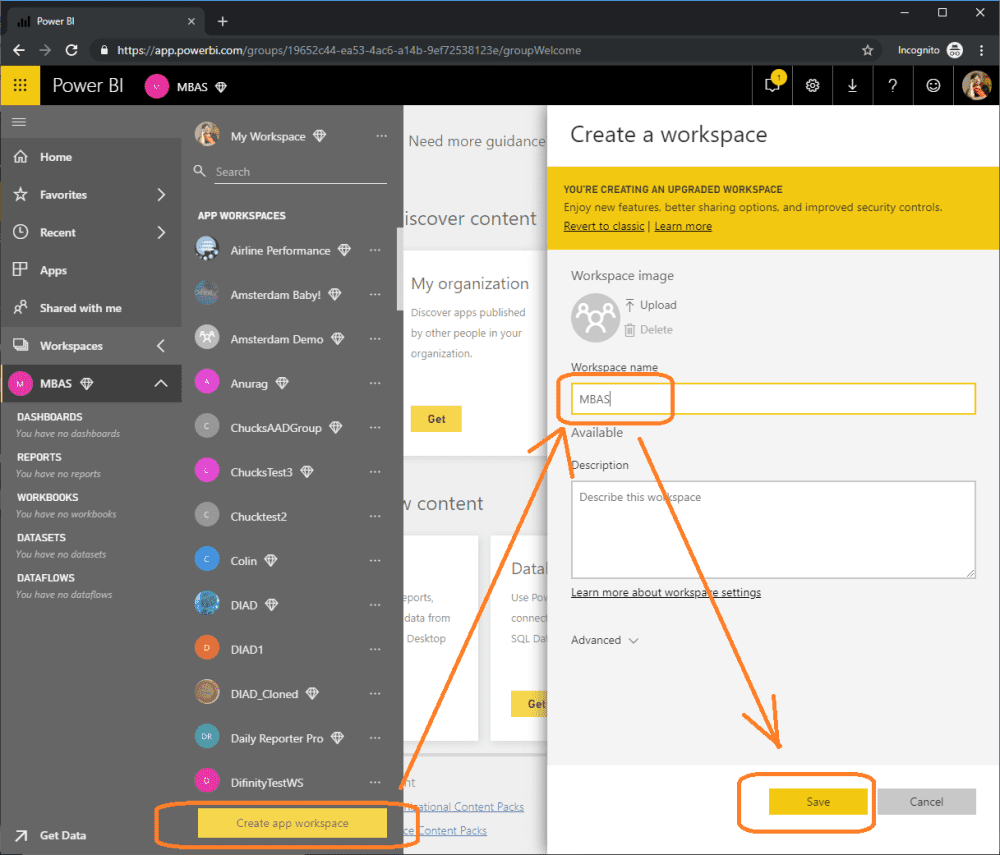
Image Courtesy: www.sharepointeurope.com
Image Courtesy: www.sharepointeurope.com
Step 2: Navigate to the workspace content view
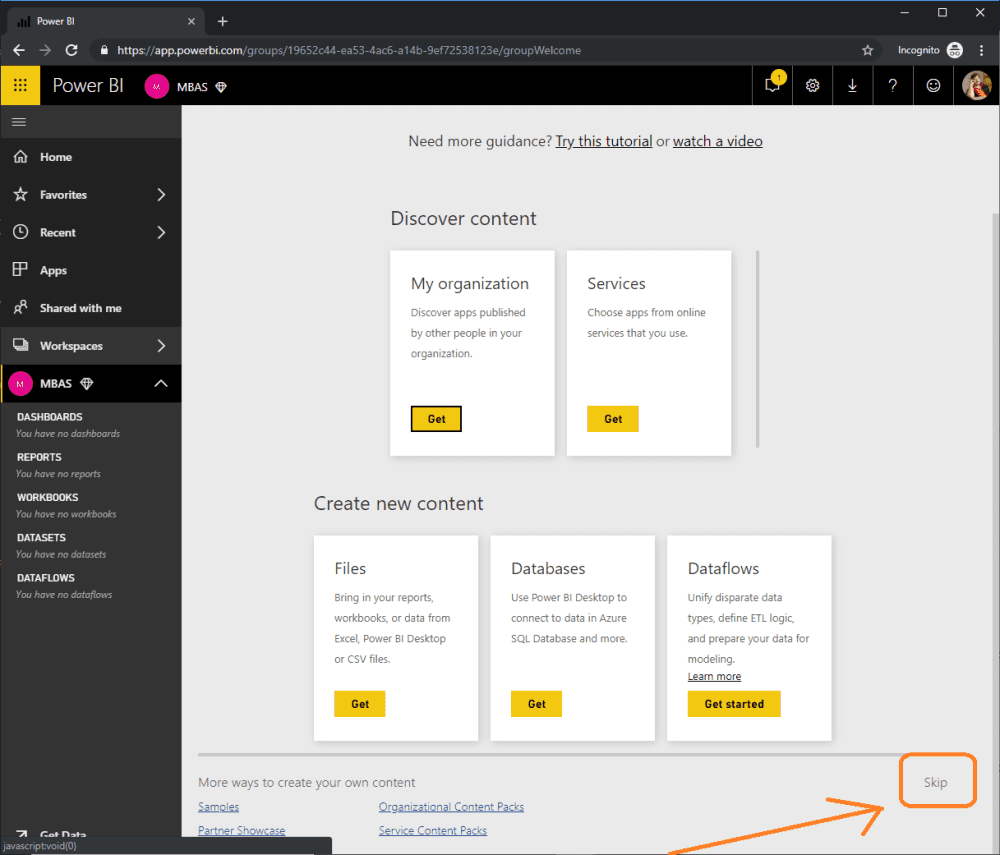
Image Courtesy: www.sharepointeurope.com
Step 3: Let’s create a streaming dataset
To create a streaming dataset, click -> create and then select -> streaming dataset
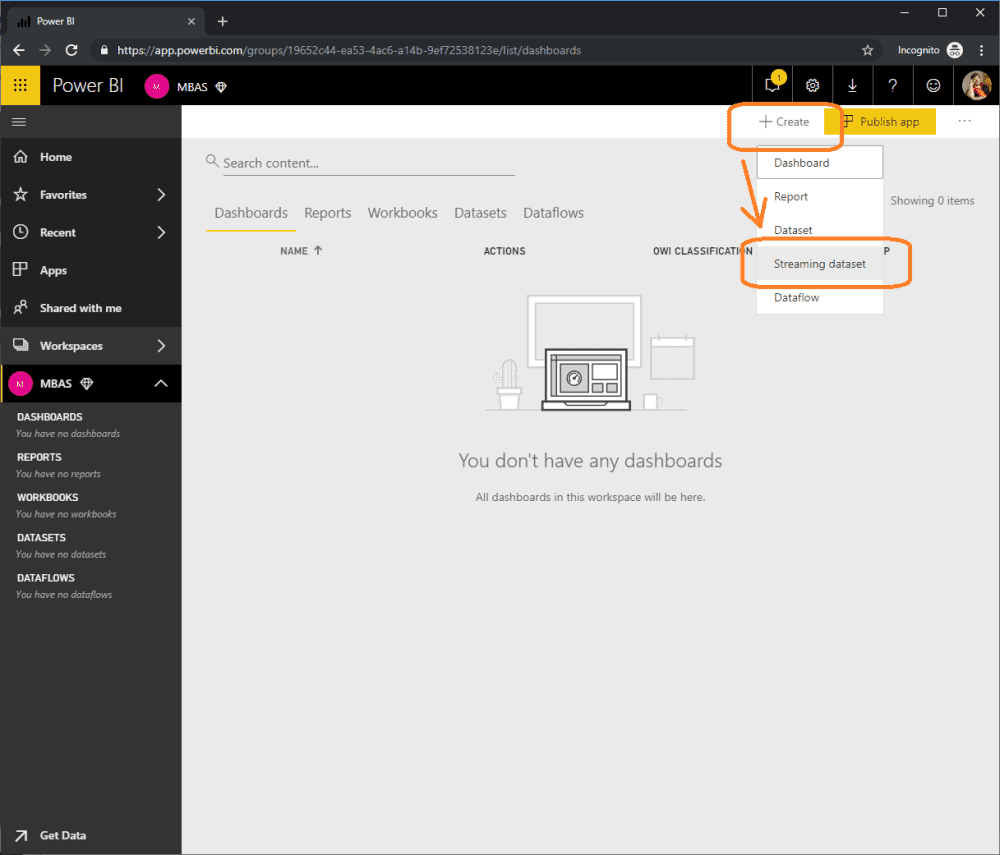
Image Courtesy: www.sharepointeurope.com
Step 4: Let’s set the streaming dataset to be API based
Now click on API and then select Next
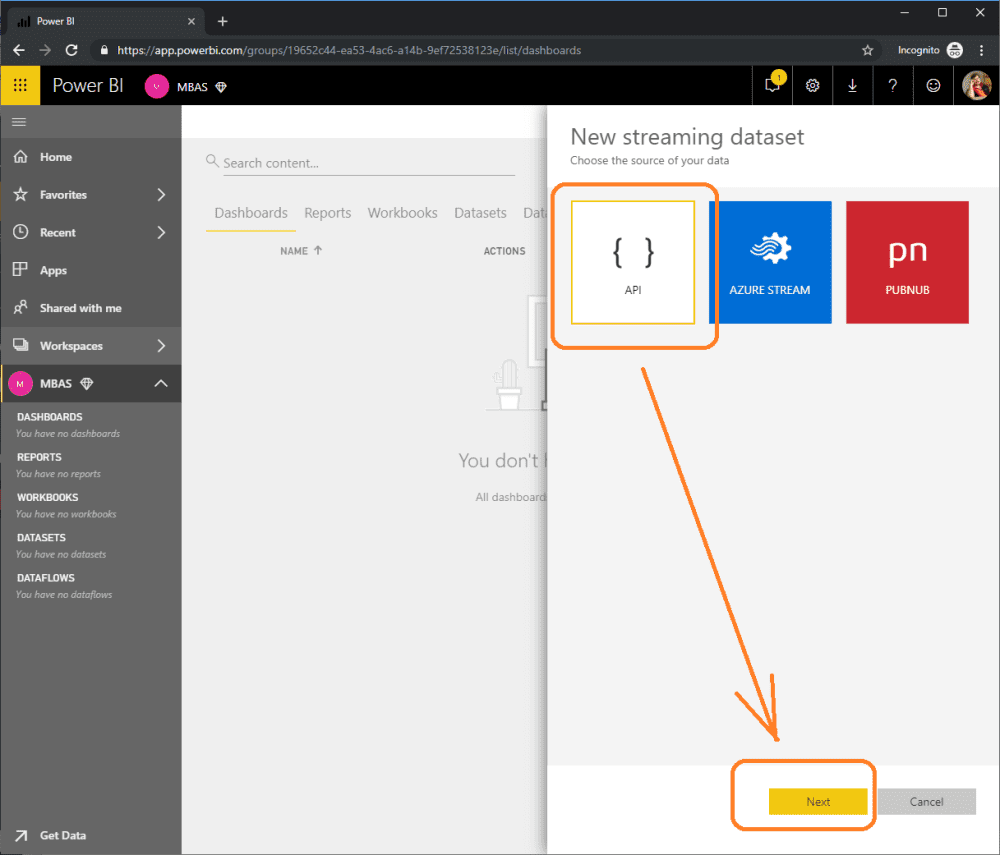
Image Courtesy: www.sharepointeurope.com
Step 5: Set streaming dataset properties
In order to set the streaming dataset properties, you need to configure the below variables;
Add the fields:
Score as NUMBER
Personas TEXT form
Contest as TEXT form
Date as DATA TIME format.
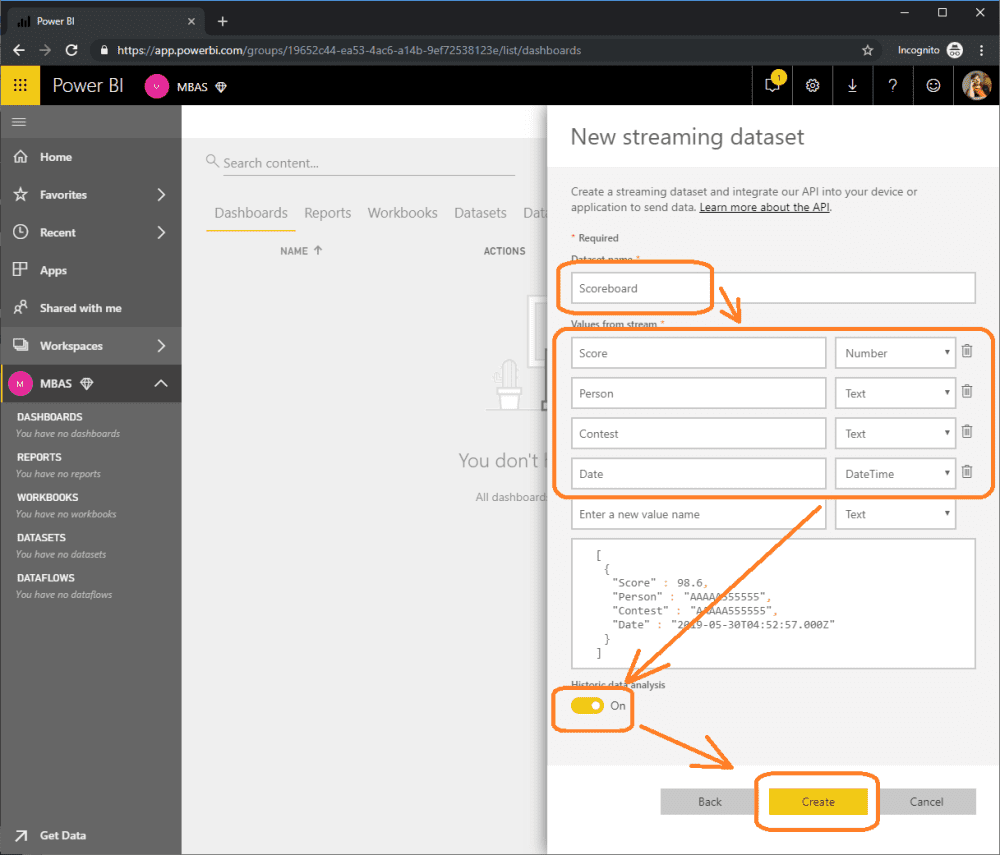
Image Courtesy: www.sharepointeurope.com
Step 6: Creating a report to display streaming dataset
In order to generate a dataset report, select the dataset. Then select the chart glyph for the dataset that was just created in step 5.
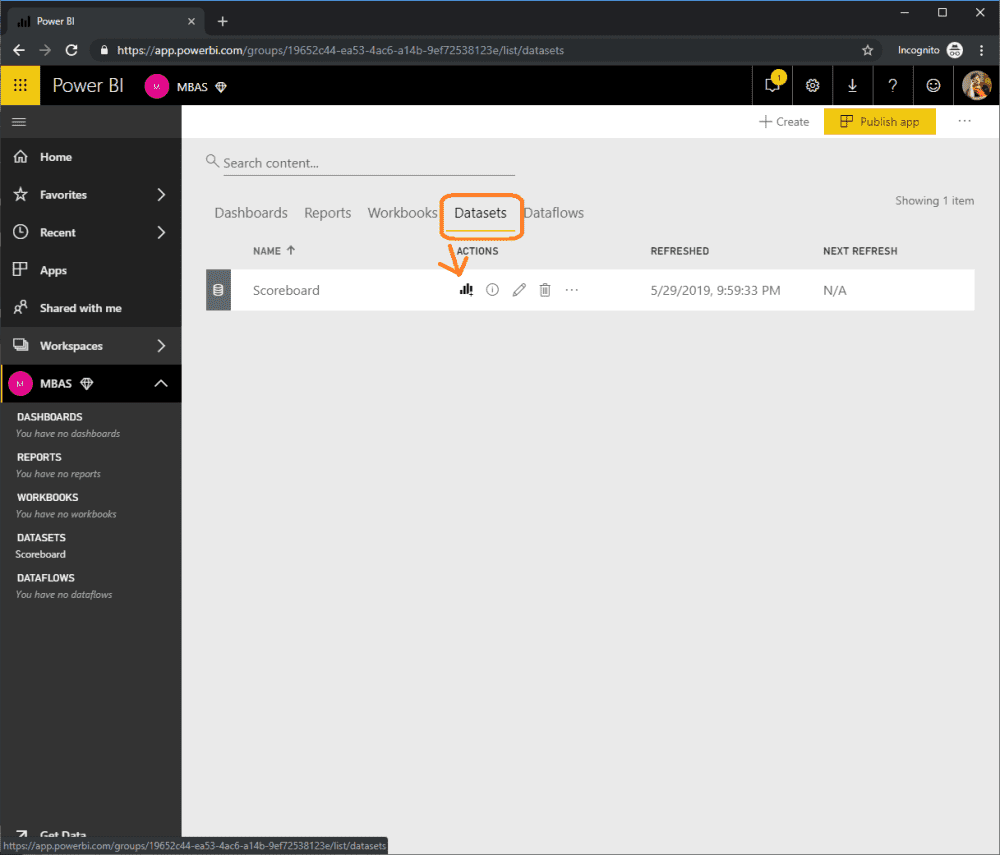
Image Courtesy: www.sharepointeurope.com
Step 7: Add a visual to display the score by a person
In order to display a person score in visual, drag the scoreboard to the design canvas. The default value should be the clustered column chart and once the value is set, add the person as the axis.
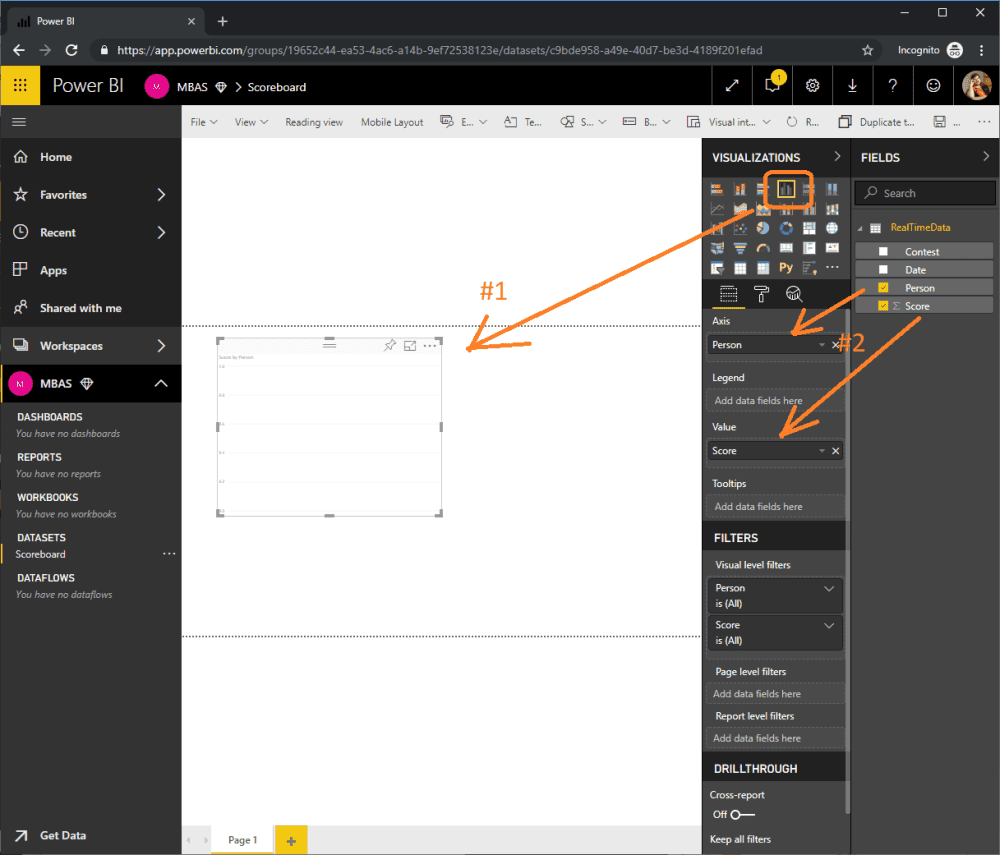
Image Courtesy: www.sharepointeurope.com
Step 8: Pin the column chart to the scoreboard dashboard
In order to pin the column chart, click the pushpin glyph from the visual and save the report with the name “Scoreboard”.
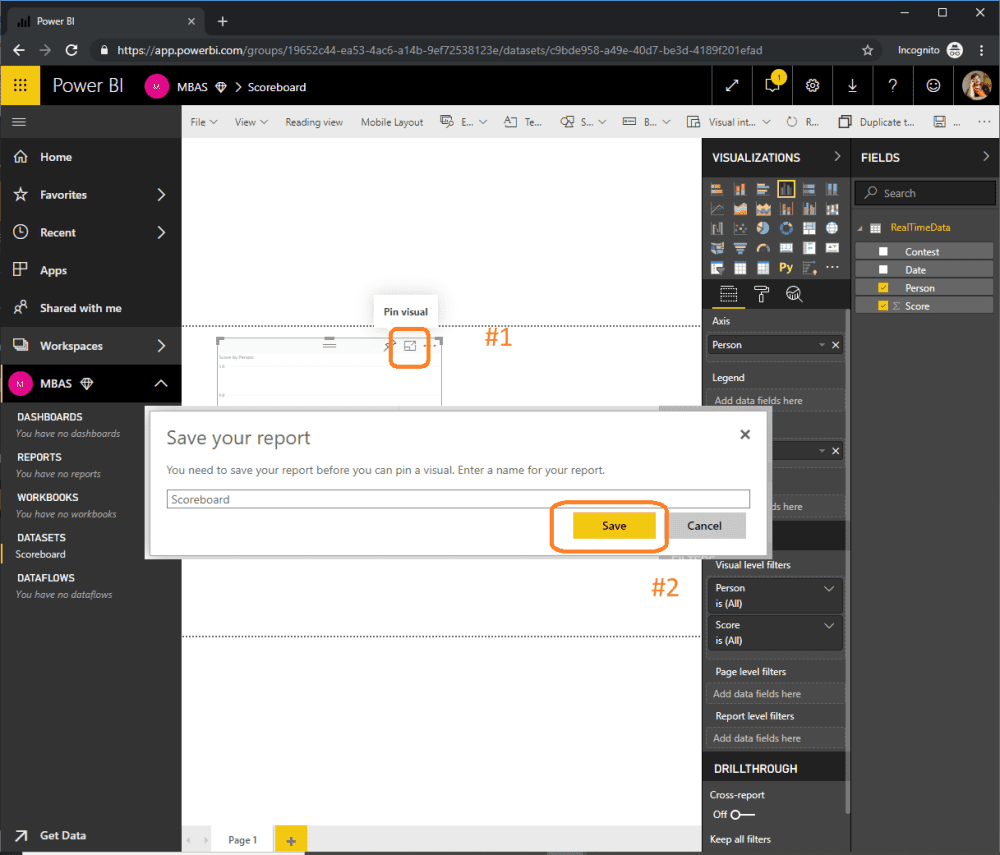
Image Courtesy: www.sharepointeurope.com
Step 9: Create a new dashboard
To create a new dashboard, select -> New dashboard and name it as “Scoreboard” and click pin.
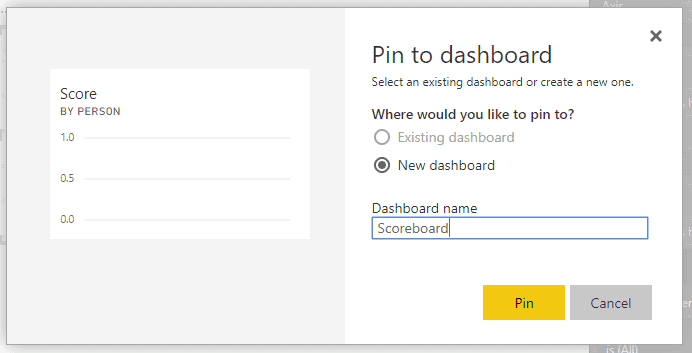
Image Courtesy: www.sharepointeurope.com
Step 10: Adding PowerApps to the PowerBI report
In the Power BI visuals, click the ellipsis and select -> Import from the marketplace. Now search for PowerApps and select -> PowerApps Preview
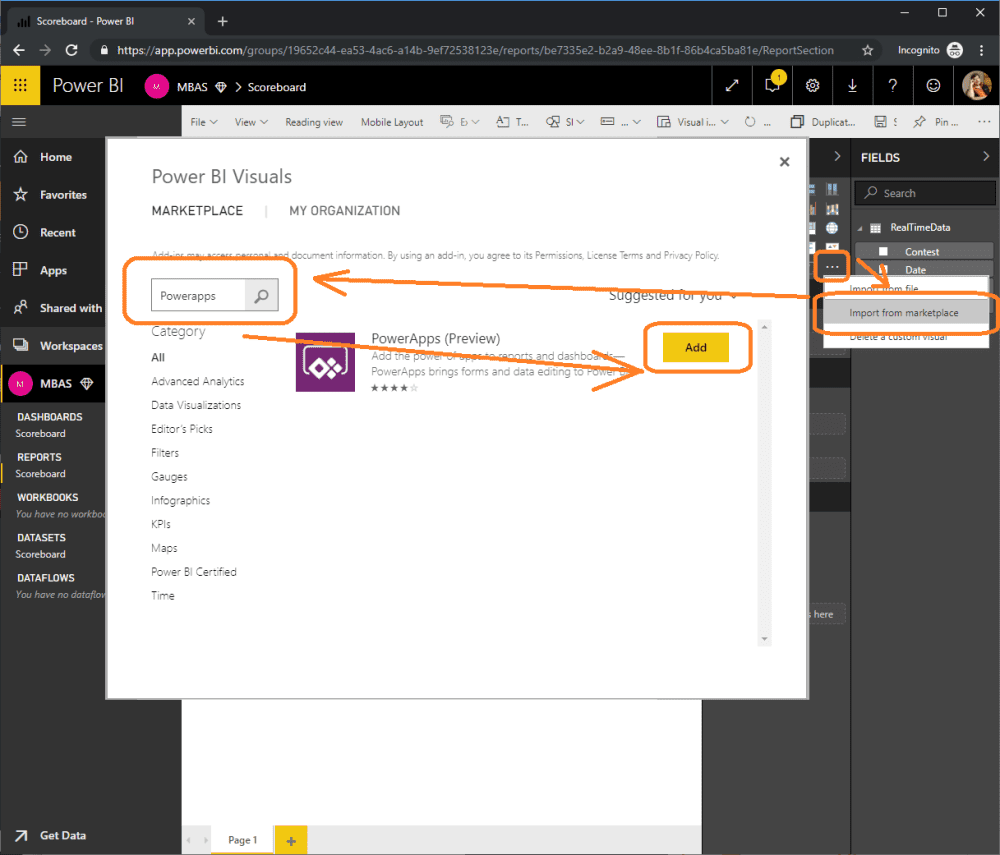
Image Courtesy: www.sharepointeurope.com
Step 11: Creating Powerapps app with PowerBI Custom Visual
Now drag the fields names contest, person and score to the PowerApps custom visual
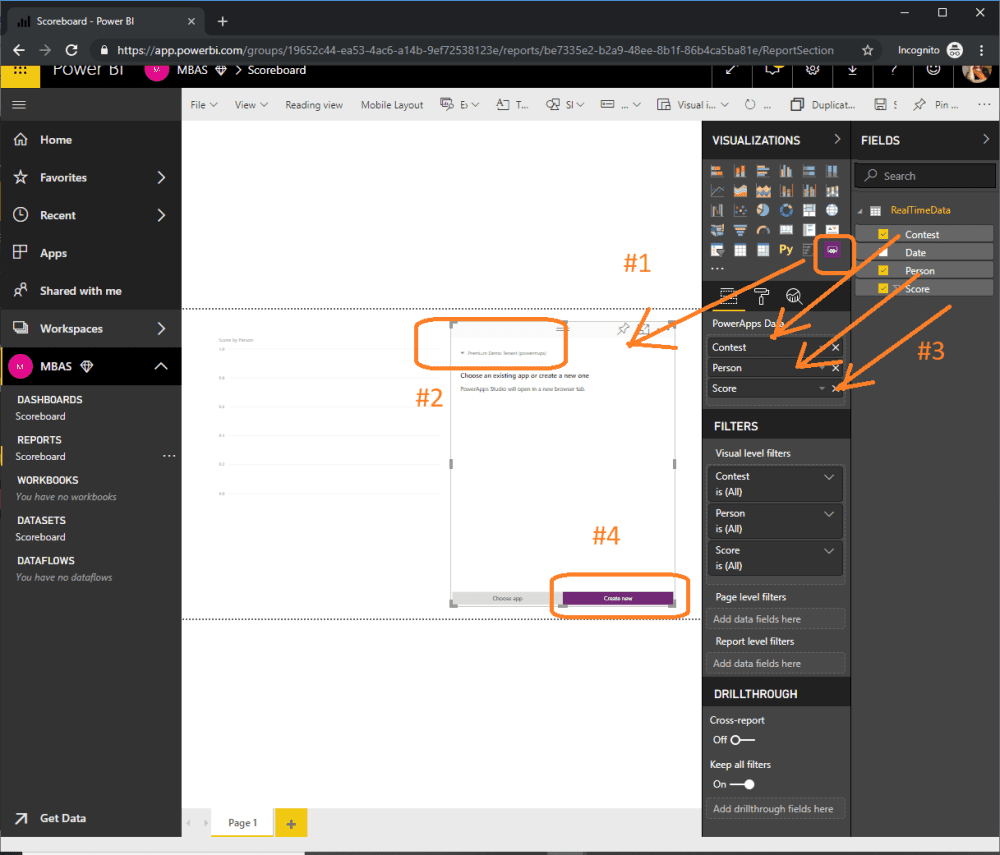
Image Courtesy: www.sharepointeurope.com
Step 12: Add Rating Control to the PowerApps application
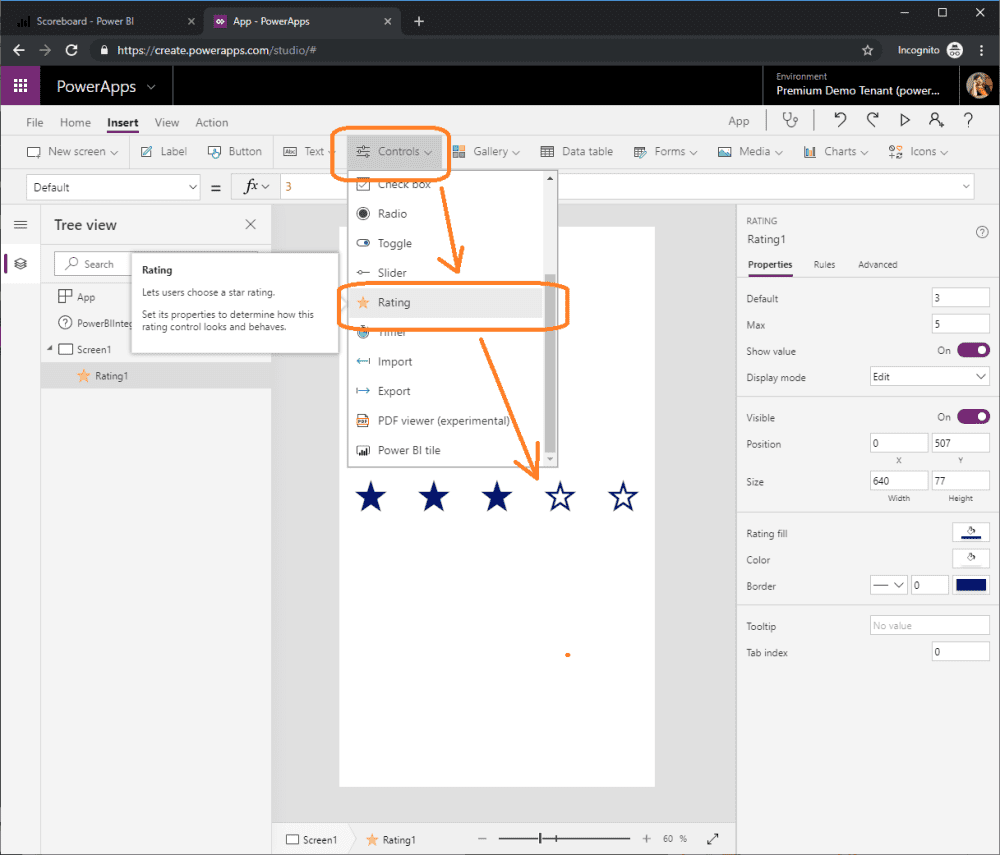
Image Courtesy: www.sharepointeurope.com
Step 13: Now add a button control to the PowerApps application
In order to confirm or cancel the report, you need to add a button control to the app.
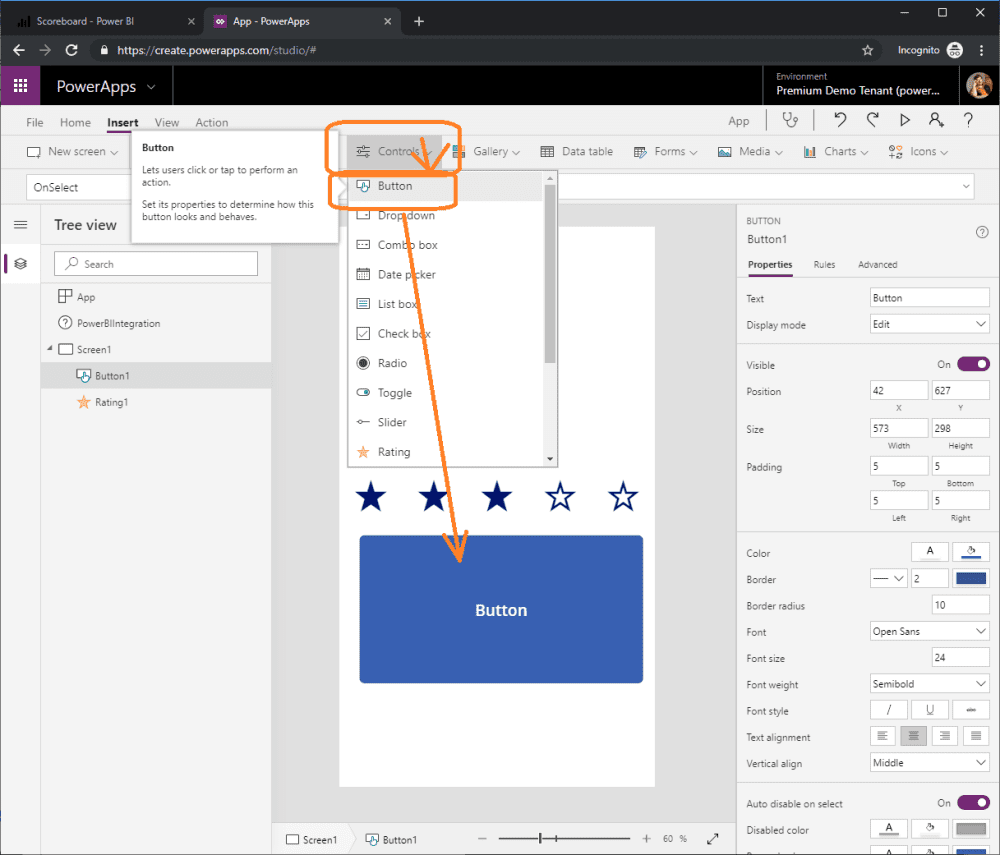
Image Courtesy: www.sharepointeurope.com
Step 14: Add a text input control in the app
In order to allow user input data, you need to enter text control in the app.
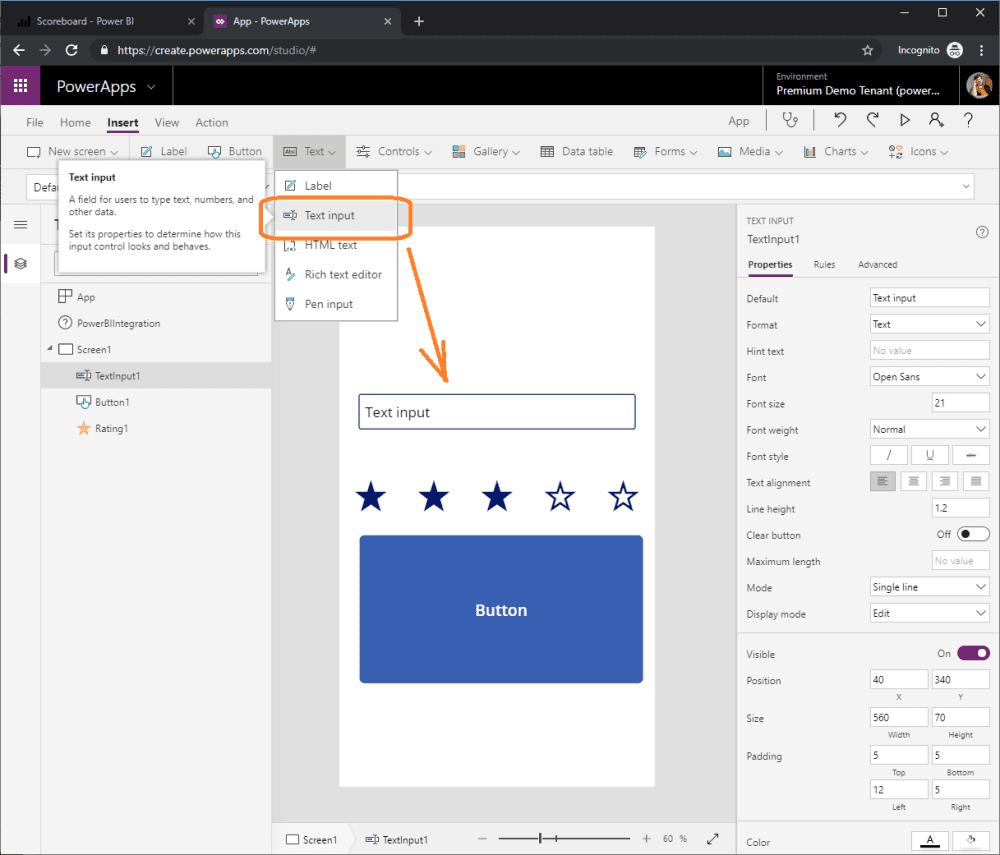
Image Courtesy: www.sharepointeurope.com
Step 15: Add a label control to the PowerApps application
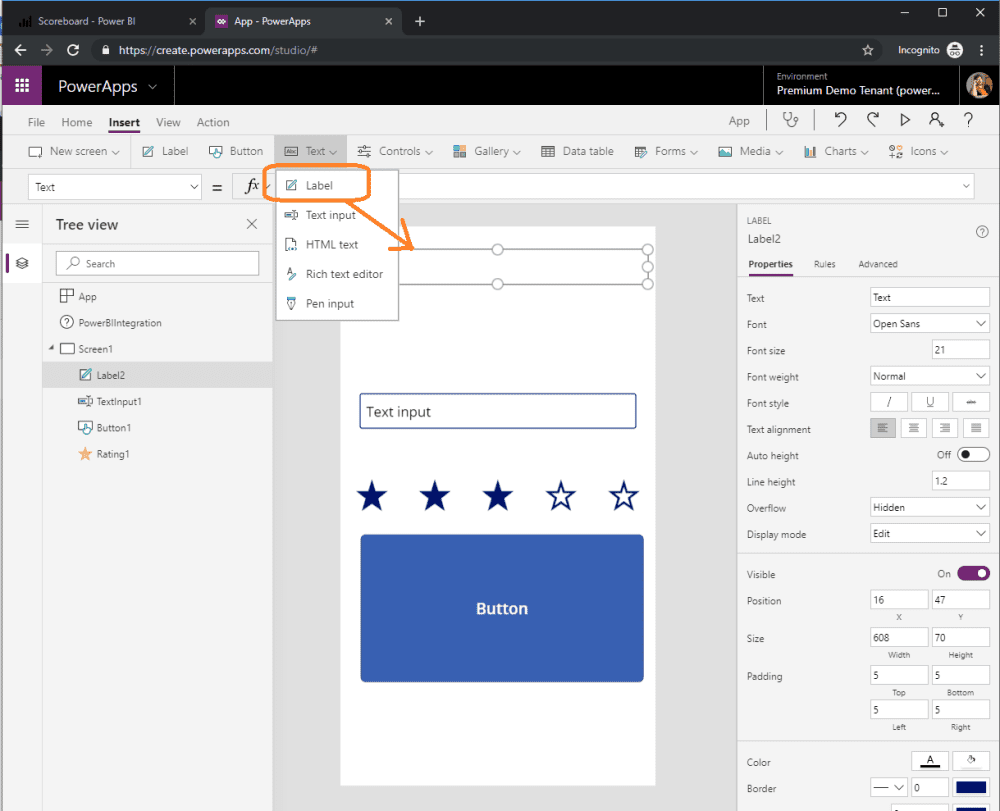
Image Courtesy: www.sharepointeurope.com
Step 16: Create a new flow and attach it to the PowerPoint presentation
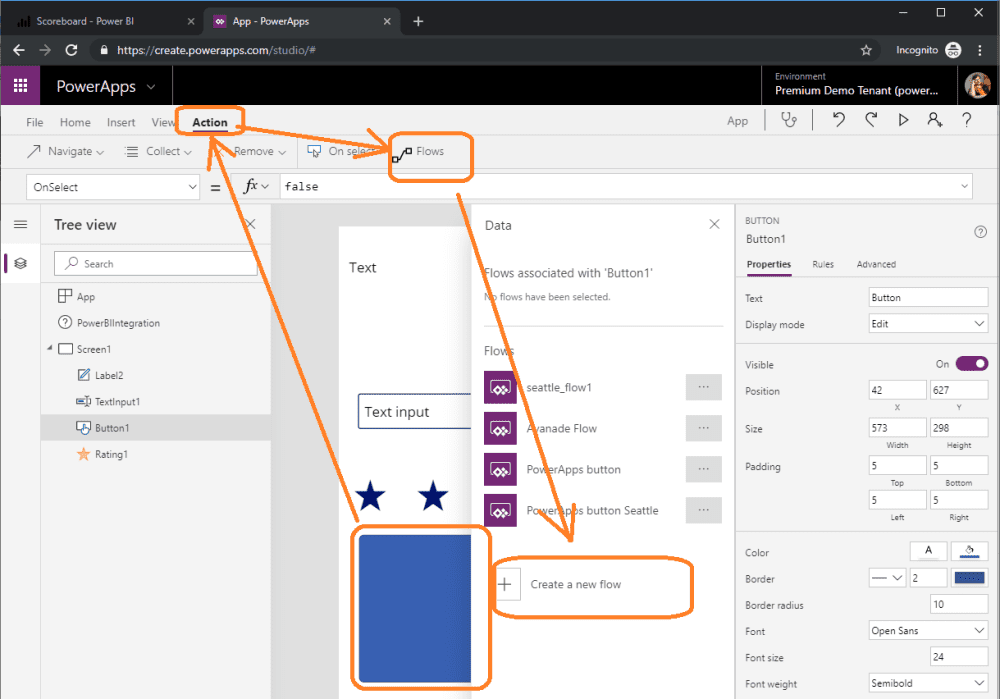
Image Courtesy: www.sharepointeurope.com
Step 17: Add PowerBI action to the flow
Once the flow is created, you can add PowerBI action to the flow.
Now set the workspace that you created in step 1
Set the dataset “scoreboard” that you set in step 5
The table created will be called “Real-Time Data”.
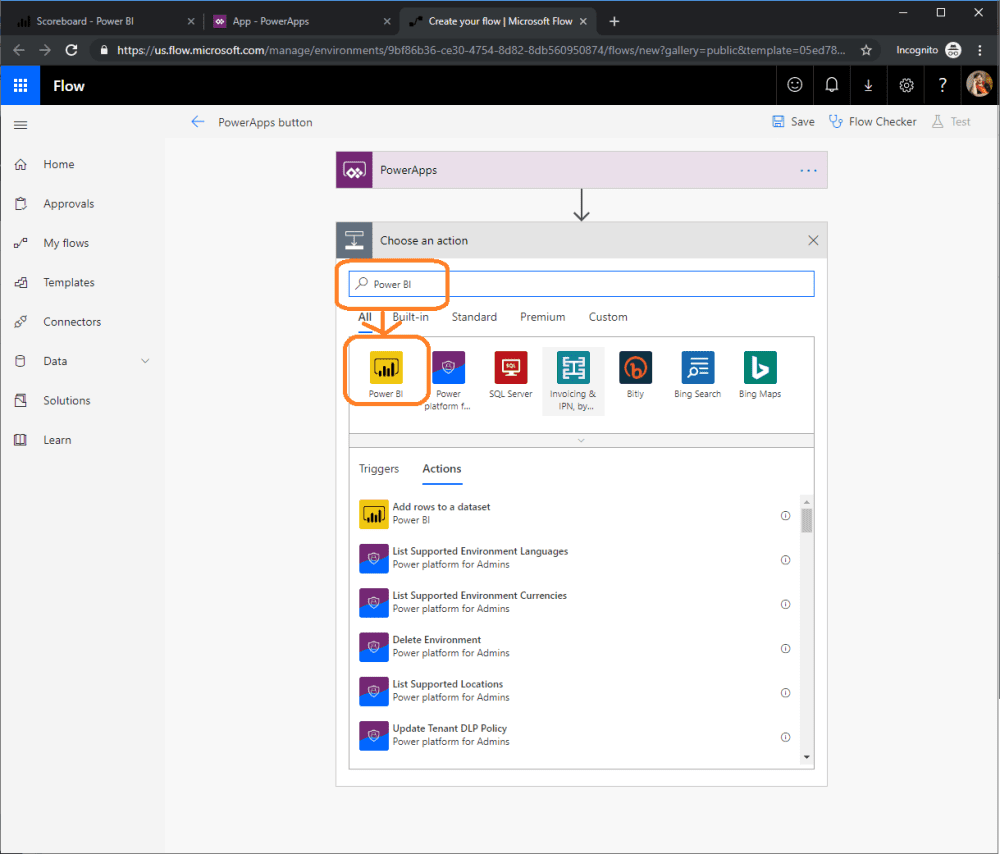
Image Courtesy: www.sharepointeurope.com
Step 18: Set Every field as “Ask in PowerApps”
Set every field as “Ask in PowerApps”. For the very first field, this option comes default. For the rest of the fields, you need to click on the “See More” option to set as above.
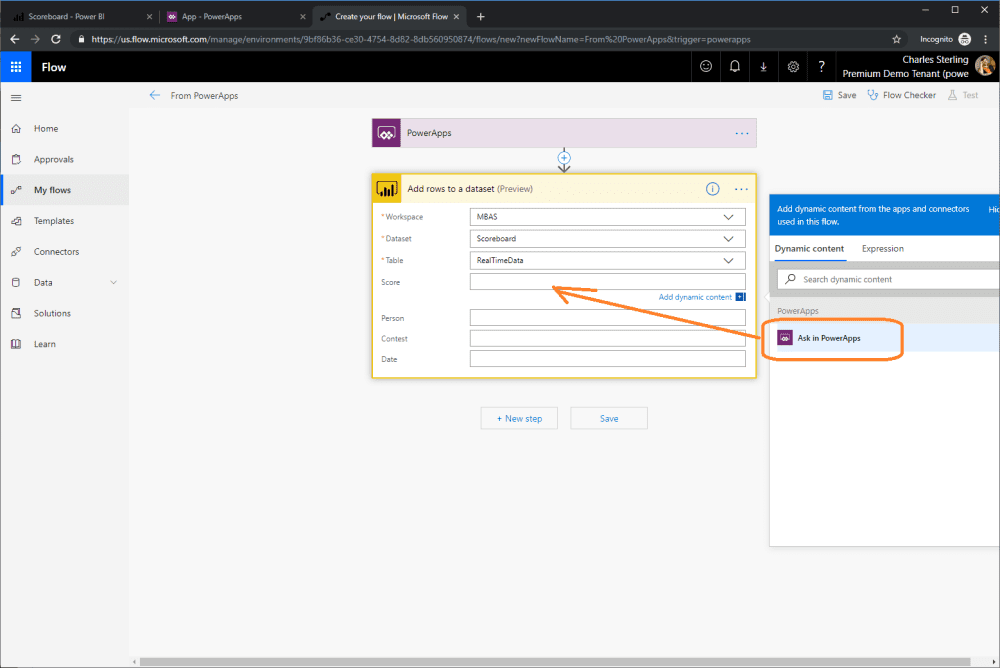
Image Courtesy: www.sharepointeurope.com
Step 19,20,21,22 has the same step. So you can add all ScreenShot in one step and ignore the rest step.
Step 19: Save your flow.
Once you’ve set all the fields, you can save your flow.
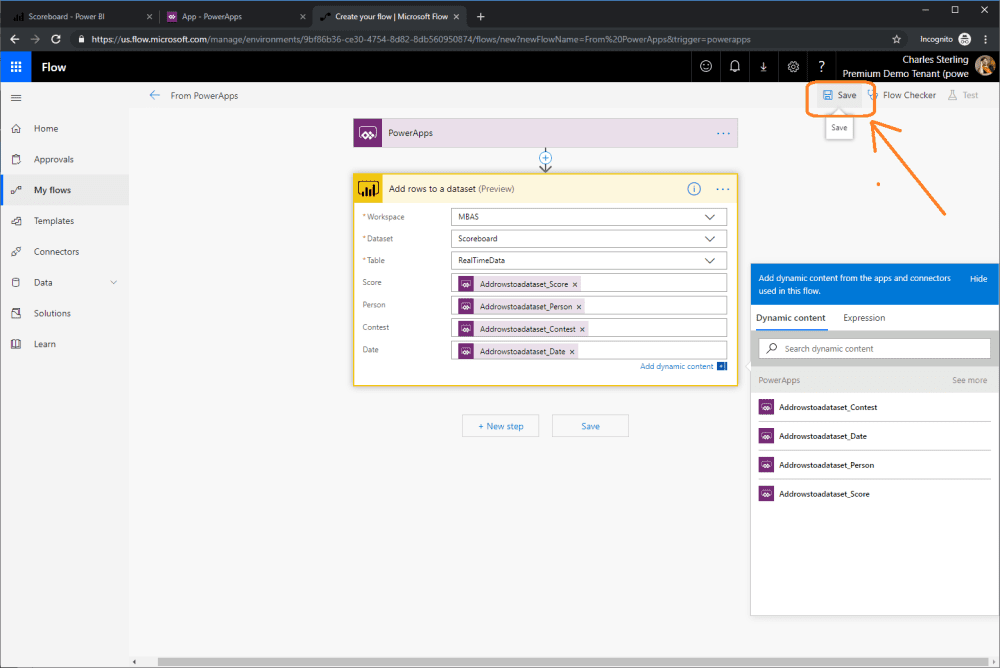
Image Courtesy: www.sharepointeurope.com
Step 20: Connect your button with the flow
Navigate to the powerapps tab and select your flow. This will add a parameter to the flow for every field in the database.
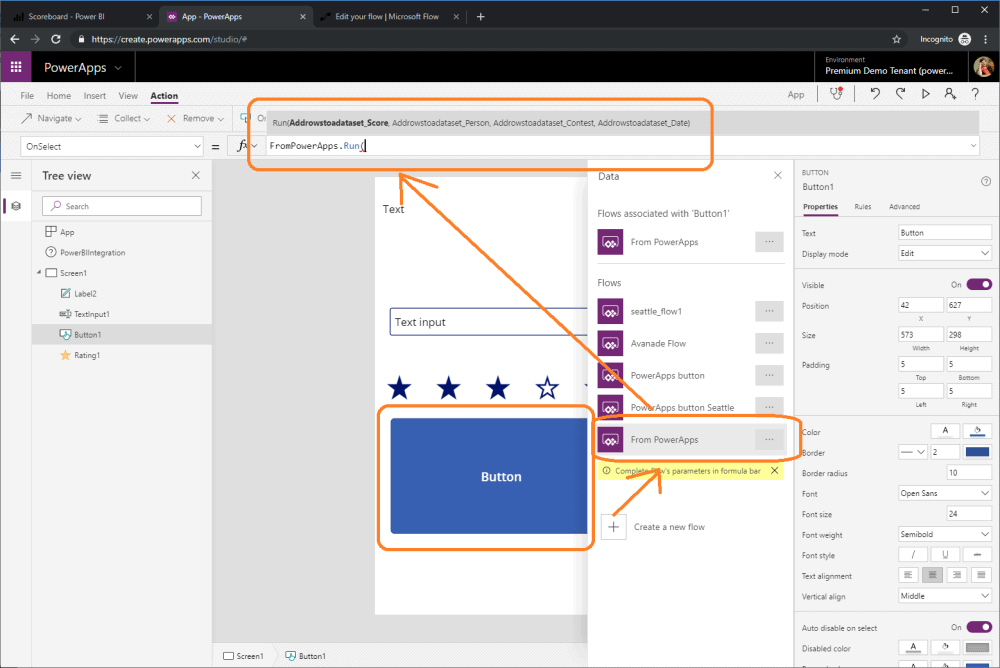
Image Courtesy: www.sharepointeurope.com
Step 21: Supply the flow parameter
Set the score flow parameter to value the rating control. Now set the below values.
Person -> TextInput
Contest -> “MBAS”
Date -> NOW()
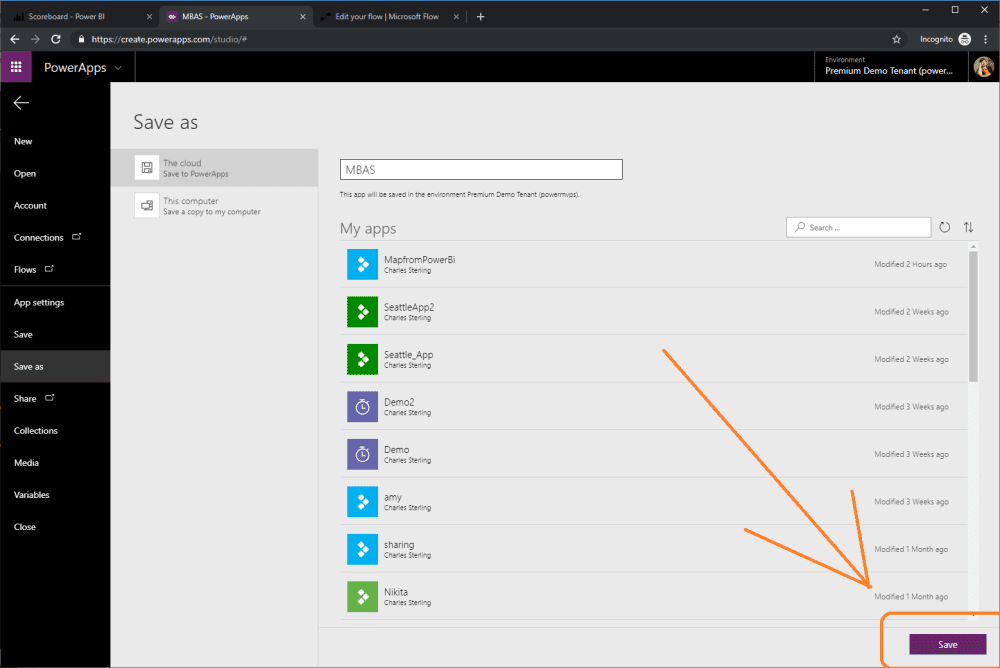
Image Courtesy: www.sharepointeurope.com
Step 22: Save the powerApps application
Under the file menu, select -> SAVE. Name your app and select the Save button.
Image Courtesy: www.sharepointeurope.com
Step 23: Pin the PowerApps app to the dashboard
Navigate -> PowerBI tab. In the upper right-hand corner, select -> Pin Visual. Now select the Scoreboard dashboard created above.
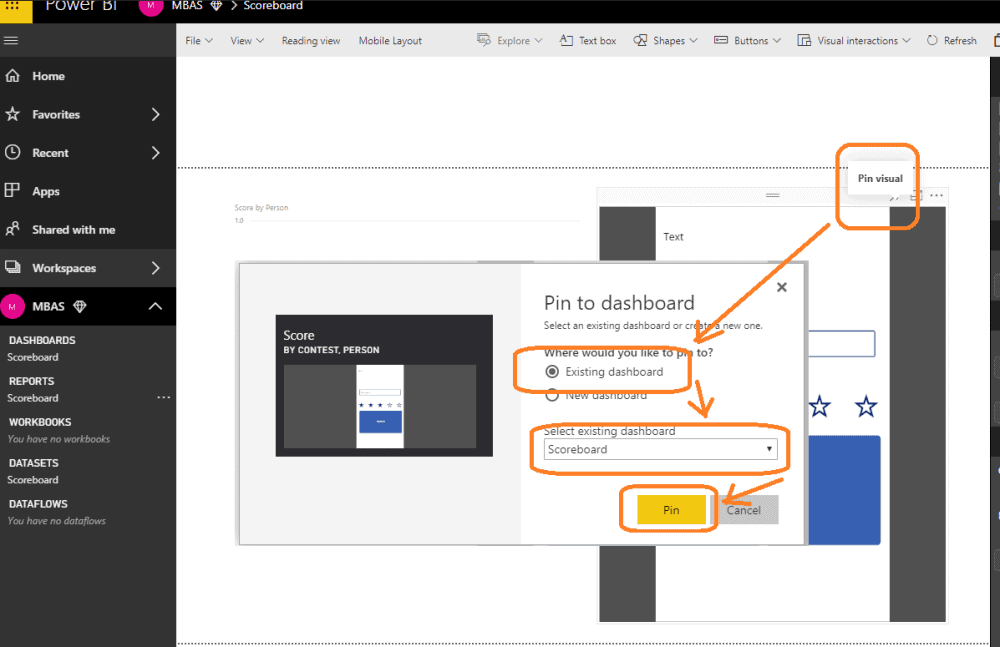
Image Courtesy: www.sharepointeurope.com
Step 24: Test Integrating PowerApps
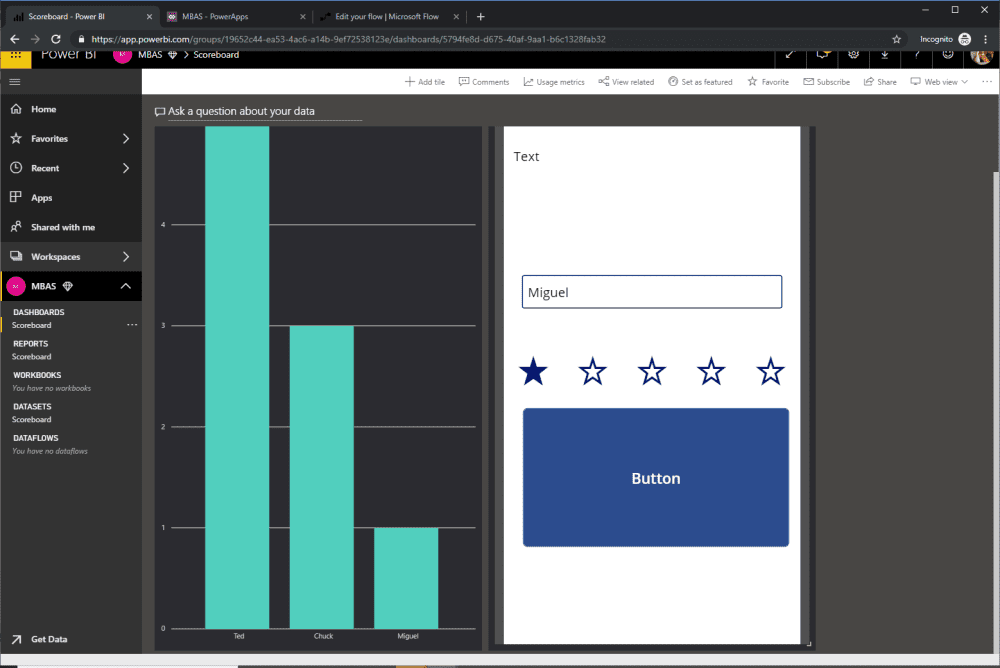
Image Courtesy: www.sharepointeurope.com
In order to test, type a person’s name and select a score and update the column chart. You have successfully created an application.
I hope the above blog will help you to build and integrate the best PowerApps software. Have you ever tried such integration before? Do let us know your experience.
Comments
Post a Comment